Discover why 2% is no longer enough with 2026 conversion rate statistics across industries, devices, and channels to optimize your digital strategy.



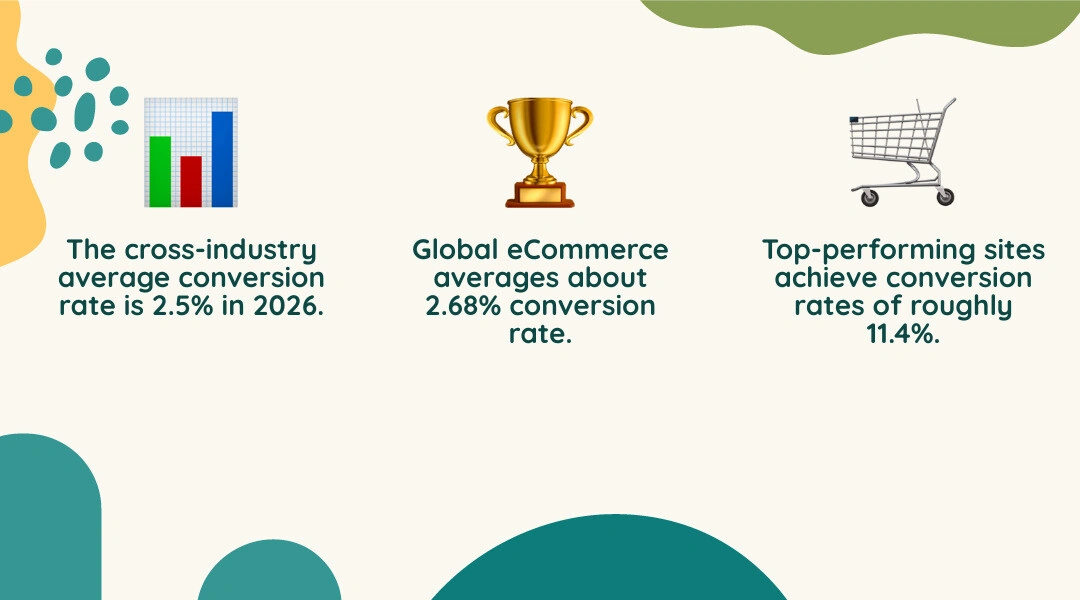
Conversion rate statistics put a 2% website conversion rate in context. The cross-industry average is about 2.5%, while top-performing sites reach roughly 11.4%. Global eCommerce averages about 2.68%, but results vary by sector, device, traffic source, and the action being measured. Compare your site with a relevant benchmark before setting a target.
A purchase and a lead form submission are different goals. Track each separately, then look for gaps in the pages and devices that matter most to your business.
I'm Ben Visser, founder of Social Design House, where I've spent 16 years building brands and websites for growing organizations. I'll use these conversion rate statistics to show where benchmarks can guide better website decisions.
Important conversion rate statistics terms:
Evaluating baseline metrics starts with recognizing that aggregate numbers blend very different business models. Across global web traffic, the mean conversion rate sits at 2.5%. However, looking at the top decile reveals that elite digital experiences convert at 11.4% or higher.
| Industry Sector | Median Conversion Rate | Top 10% (Elite Performance) | Typical Primary Goal |
|---|---|---|---|
| Professional Services | 4.6% | 11.2% | Consultation Request / Lead Form |
| Legal Services | 3.4% | 8.9% | Case Evaluation Form |
| Finance & Banking | 3.1% | 8.5% | Application / Account Creation |
| Healthcare | 3.0% | 7.8% | Appointment Booking |
| Food & Beverage | 4.9% | 10.5% | Direct Purchase / Subscription |
| B2C eCommerce (Overall) | 2.1% | 6.2% | Transaction / Order Placement |
| B2B eCommerce | 1.8% | 4.9% | Bulk Order / Quote Request |
| Fashion & Apparel | 1.9% | 4.5% | Retail Purchase |
| Luxury Goods & Jewelry | 0.69% | 2.1% | High-Ticket Inquiries / Sales |
According to datasets compiled in Landing Page Conversion Rate Benchmarks 2026 | By Industry, treating cross-industry medians as a single finish line creates false security. High-intent sectors such as financial consulting and legal representation naturally command higher baselines because their audiences arrive seeking urgent solutions. Meanwhile, high-volume retail platforms face heavy comparison shopping.
B2B and B2C funnels operate on fundamentally different mechanics. B2C websites average a 2.1% conversion rate, driven by immediate emotional payoff, straightforward checkout processes, and personal payment decisions.
B2B eCommerce trails slightly at 1.8% for self-serve transactions. When B2B transitions into consultative pipelines, the picture changes entirely. Professional services achieve an average 4.6% conversion rate, legal services reach 3.4%, and healthcare platforms convert at 3.0%. Finance maintains a steady 3.1% benchmark despite significant compliance friction.
In consultative B2B settings, shorter buying journeys yield higher conversion percentages at top-of-funnel touchpoints. At consultative top-of-funnel touchpoints, visitors book discovery calls or download technical briefs, which reduces the immediate commitment barrier.
Within digital commerce, sector-level variance is substantial. Personal care and beauty products lead consumer goods with conversion rates reaching 6.8%. Routine repurchase cycles and lower price points create minimal hesitation. Food and beverage brands also perform exceptionally well, maintaining an average 4.9% conversion rate.
At the other end of the spectrum, fashion and apparel linger around 1.9%, weighed down by sizing uncertainty and aggressive open-tab browsing. Luxury goods and jewelry struggle the most, averaging 0.69%. When an order value climbs into thousands of dollars, consumers treat the website as a research catalog rather than a point of sale.
Real-world store metrics show that the median conversion rate for direct-to-consumer stores sits at 1.17%. Half of all stores operate between 0.92% and 1.52%, proving that double-digit conversion numbers in retail require intentional execution rather than passive reliance on default templates.
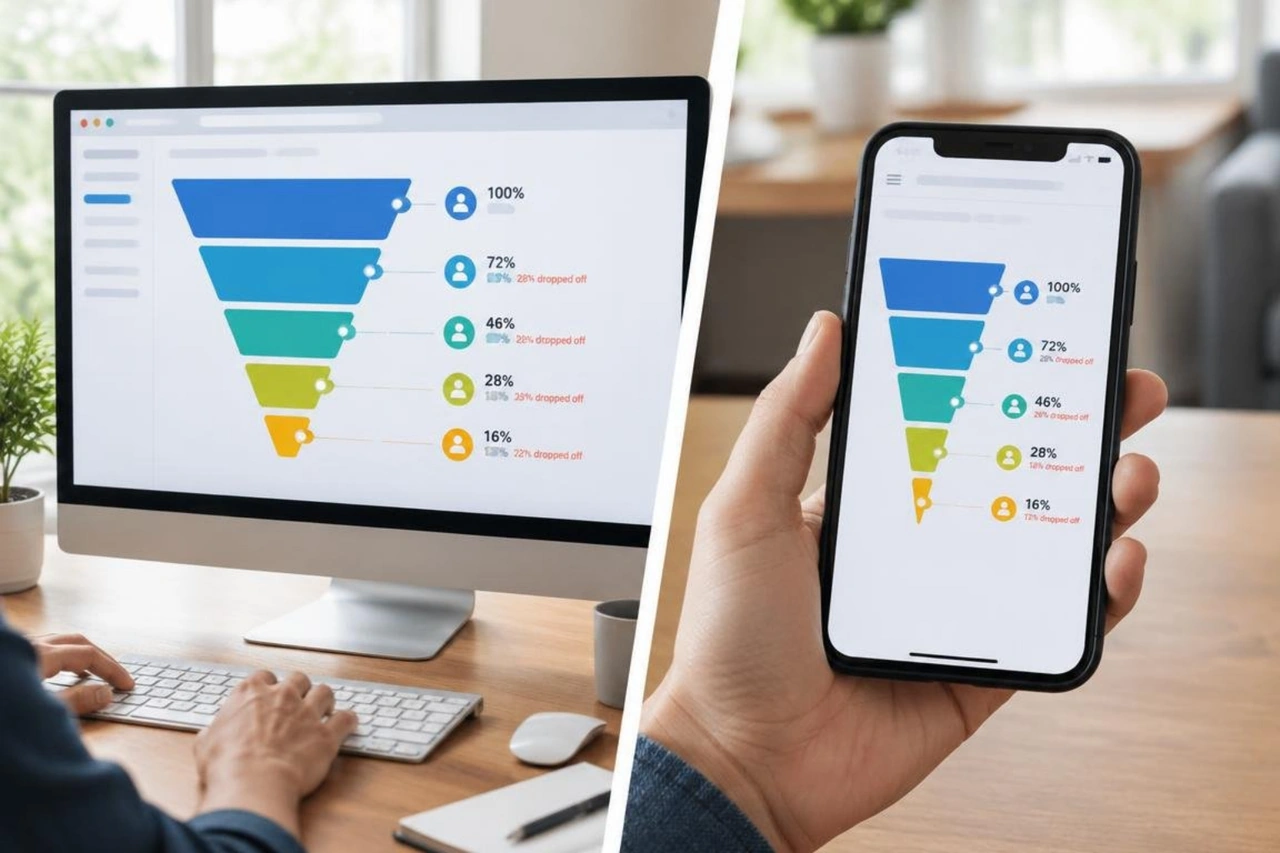
Technical performance dictates whether a visitor ever experiences your carefully crafted brand story. You can run pristine marketing campaigns, but if your platform stumbles on execution, visitors bounce instantly.
Page load latency acts as a direct tax on your balance sheet. Research shows that websites loading in one second achieve conversion rates three times higher than those taking five seconds. A delay of just a single second drops conversions by 7%.
Core Web Vitals establish the foundational stability of your digital storefront. When a site stutters during interaction, potential buyers lose confidence and leave. If you are diagnosing why an otherwise attractive website not converting properly, technical speed and script execution are the first places to inspect.
Desktop devices maintain an average 4.8% conversion rate, while mobile devices achieve roughly 2.9%. This gap persists even though mobile hardware generates nearly 60% of global web traffic and retail volume.
The discrepancy stems from physical usability constraints:
Desktop users benefit from larger screens, steady connections, and physical keyboards, making high-friction tasks like entering credit card numbers or reading contract terms much simpler.
Across global digital commerce, cart abandonment stands at 70.19%. On mobile devices specifically, abandonment climbs to 77.2%.
Shoppers abandon purchases for predictable reasons: unexpected shipping fees at the final step, mandatory account registration, complex security checks, and clunky field validation. Implementing native digital wallets like Apple Pay and Google Pay cuts this drop-off significantly. Providing seamless one-click payment paths removes the need to type billing addresses manually, protecting conversions at the moment of highest intent.
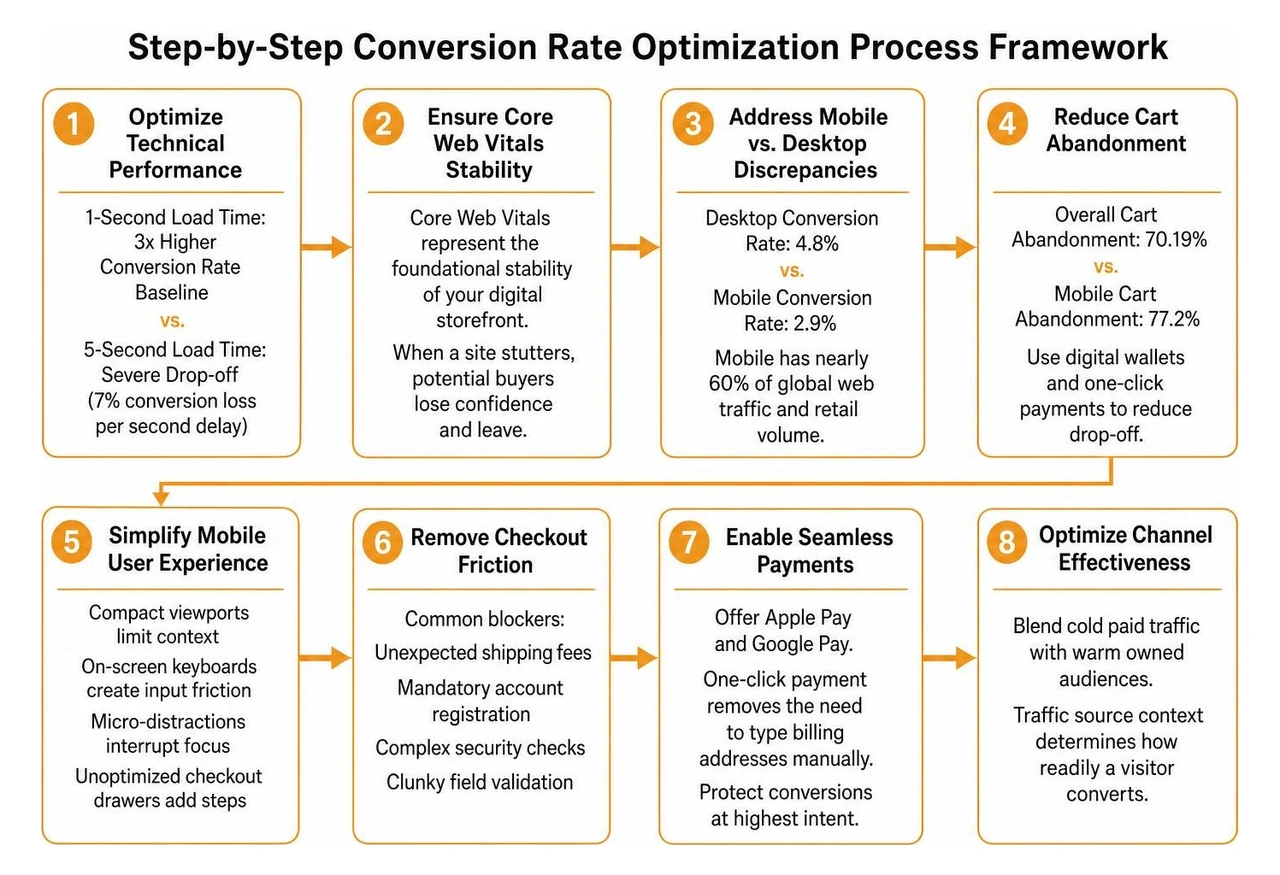
Traffic source context heavily determines how readily a visitor converts. Blending cold paid traffic with warm owned audiences produces misleading conversion averages.
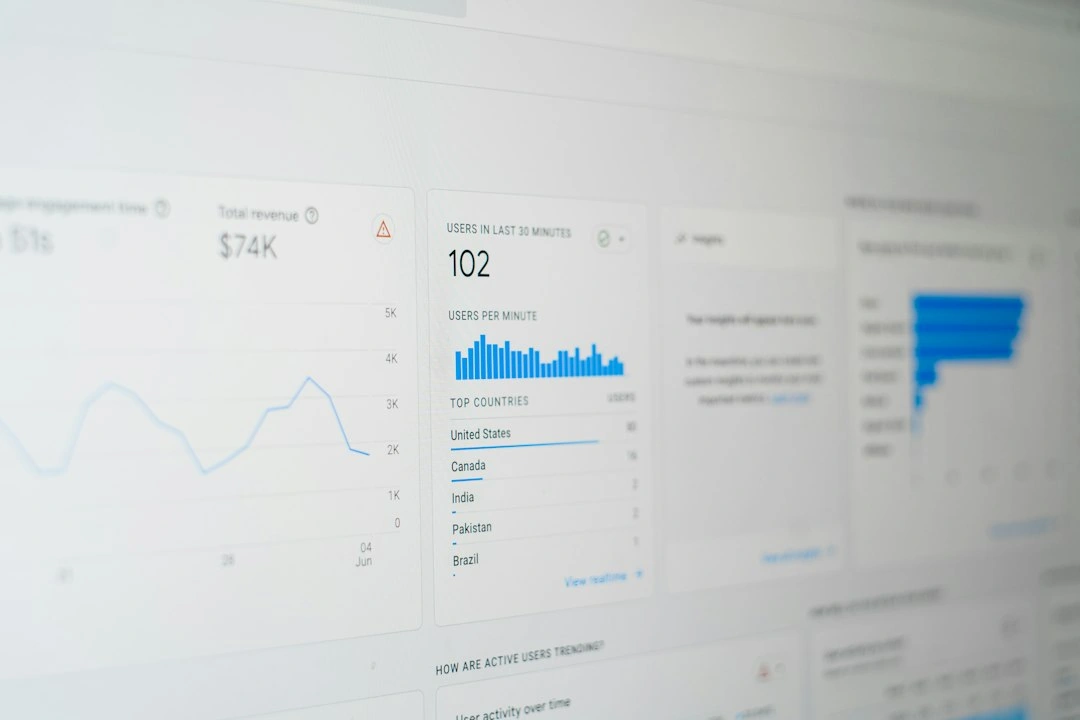
Paid search campaigns achieve average conversion rates of 3.2%, though modern smart bidding strategies push baseline PPC performance up to 7.52% in optimized accounts across major advertising networks. Organic search traffic delivers steady 2% to 4% conversion rates across industries, benefiting from high informational intent and strong domain authority.
Owned channels consistently outperform rented audiences. Email marketing delivers an extraordinary 15.22% average conversion rate across industries, generating a 4,300% return on investment.
Automated behavioral email sequences convert at roughly 1.42%, outperforming generic broadcast newsletters by nearly thirty times. Social media channels show wide variance:
Rising click costs across every major ad network require teams to capture more value from every session. When acquisition costs rise, conversion rate efficiency becomes the primary lever protecting your customer acquisition margins.
Treating paid ads and landing pages as separate efforts guarantees wasted budget. Aligning landing page headlines directly with ad creative ensures users immediately confirm they have landed in the right spot. Understanding how analytics factor into our UX work helps connect visitor behavior with ad spend efficiency, ensuring marketing dollars drive measurable pipeline growth.
The median landing page conversion rate across all industries sits at 6.6%. Top-performing standalone landing pages exceed this mark by building focused layouts that eliminate distracting secondary links.
Data published in 43 Conversion Rate Optimization Statistics [2026] demonstrates that pages keeping visible layout elements under ten convert at twice the rate of cluttered alternatives. Incorporating high-production product or explainer videos increases conversion rates by up to 86%, giving visitors an engaging way to understand complex offerings in seconds.
Building these high-converting experiences requires disciplined website conversion design, where typography, color contrast, visual hierarchy, and copy work together to guide visitors toward action.
Small design refinements often create substantial lifts in conversion volume:
Systematic experimentation separates high-performing organizations from those guessing at web design changes. Routine A/B testing programs produce steady 15% to 20% conversion gains over time.
Deploying AI-driven dynamic content engines allows websites to alter value propositions based on industry vertical or traffic source in real time. Adding instant live chat capabilities lifts conversions by 40% by resolving buyer questions before they bounce.
Scaling these results requires a structured website conversion testing guide paired with a solid digital user experience strategy to ensure test ideas originate from actual customer feedback rather than subjective internal preferences.
A baseline conversion rate across general web traffic is approximately 2.5%. Elite digital experiences perform above 11.4%. A healthy target depends entirely on your industry and business model. For example, direct retail eCommerce often averages around 2.1%, while high-touch professional services land near 4.6%.
Mobile conversion rates sit near 2.9% compared to 4.8% on desktop. This performance gap is driven by smaller viewing areas, slower cellular connections, awkward keyboard data entry, and frequent environmental distractions during mobile sessions.
Page speed and form complexity directly govern conversion volume. A site loading in one second converts at roughly three times the rate of a site taking five seconds to load. Each additional second of delay cuts conversions by 7%. For forms, reducing fields down to two or three inputs boosts submission rates by 40% compared to five or more inputs.
Relying on a static 2% conversion benchmark leaves substantial revenue on the table. Today's top-performing digital brands treat conversion rate optimization as an ongoing practice of user research, speed enhancement, layout refinement, and iterative testing.
For 16 years, our 10-person fractional creative team at Social Design House has operated from Charlotte, NC, helping growth-focused organizations build clear brand strategies and high-performing web platforms. Whether you operate in commercial real estate, art and museums, non-profit sectors, the wine industry, or mortgage lending, clarity is a gift. When your messaging matches user expectations and your digital design eliminates friction, sustainable growth follows.
Explore how Social Design House can help your team find your sweet spot and build a website that turns traffic into measurable business momentum.