Explore 10 real-time website examples that boost engagement and conversions, from dashboards to live maps, and learn how to build dynamic user experiences.
.svg)


A standard interactive website reacts to user input locally in the browser. When you click an accordion, expand an image gallery, or hover over a navigation dropdown, client-side scripts update the visual layer. The page feels responsive, but the data itself remains static until a new request is sent to the server.
A modern real-time website maintains continuous synchronization between the client and server. Instead of waiting for a manual page refresh, the interface listens for events, streaming data back and forth with near-instant latency. This bi-directional communication ensures that every visitor sees the latest information the moment it becomes available.
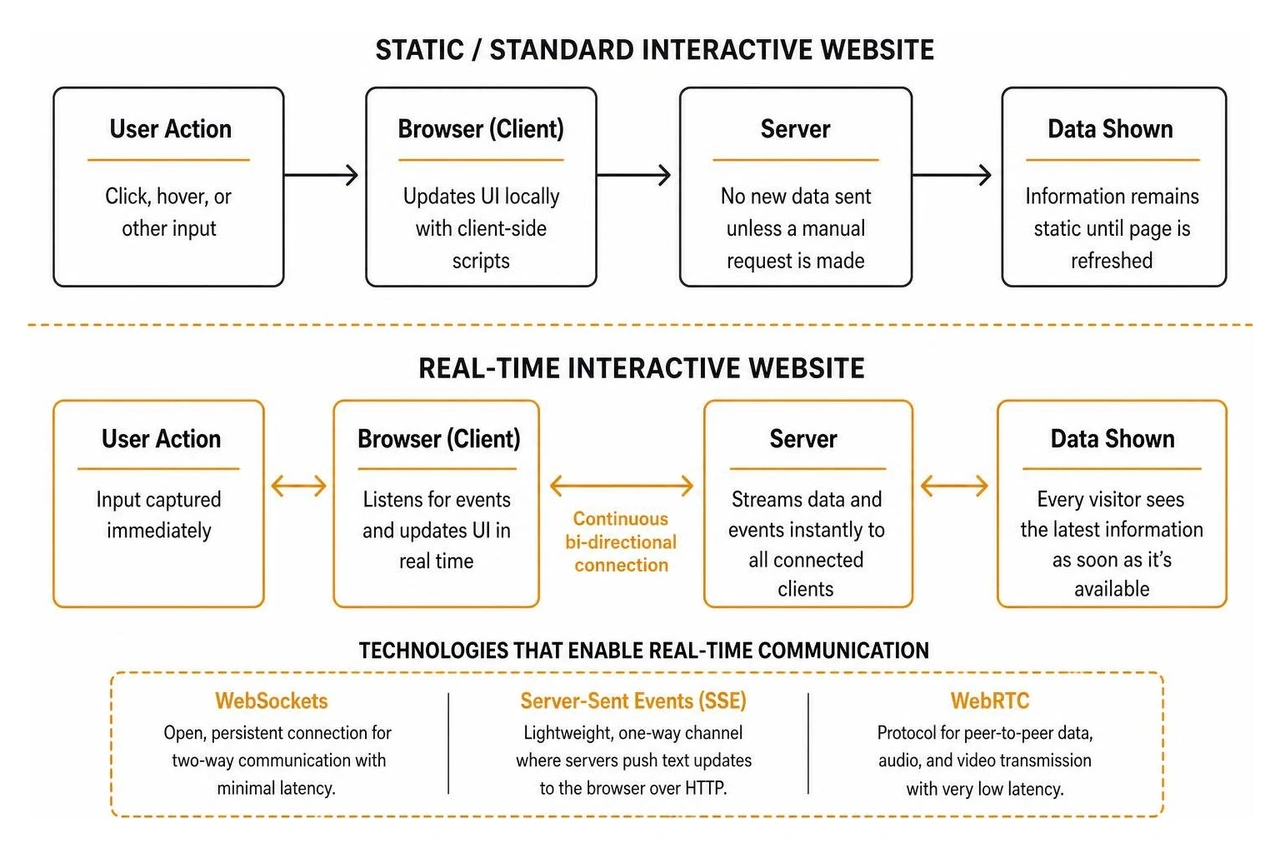
Several foundational technologies make this continuous data flow possible:
These tools allow platforms to support collaborative editing, live activity streams, and instant user feedback. Over 80% of users prefer websites that respond to their actions in real time, and websites with interactive elements produce up to a 70% higher conversion rate on average. When users spend 2x more time on interactive websites, real-time data becomes a practical driver of trust and audience retention.
Below are ten practical real-time website designs. They range from space tracking dashboards and supply-chain logistics control rooms to civic wait-time trackers and dynamic e-commerce platforms.
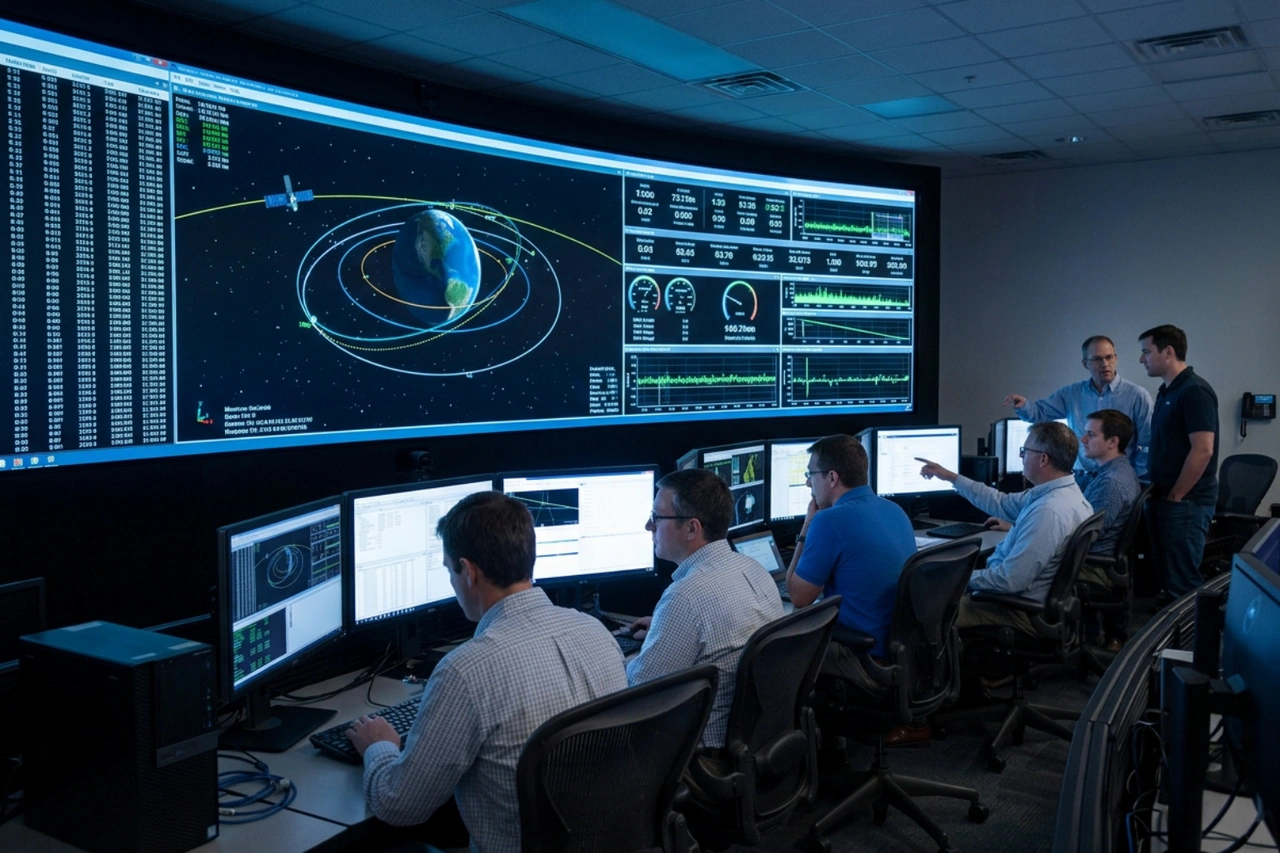
Tracking high-speed orbital flight requires continuous data streaming and clear spatial visualization. The A.T.L.A.S - Michael Overton project visualizes live telemetry for NASA's Artemis II mission, monitoring spacecraft parameters, Deep Space Network antenna status, and orbital trajectories.
Key design and technical strengths include:
This build demonstrates that complex, multi-panel data experiences can run smoothly on vanilla JavaScript and WebGL without heavy frontend dependencies.
Logistics management demands rapid awareness of shipping delays, customs holds, and inventory shortages. The vugarfamiloglu/supplytrack-chain platform functions as an interactive mission-control room for global freight.
Standout features of this application include:
Using SSE instead of full WebSockets keeps the connection logic simple while delivering live freight tracking with minimal server load.
Monitoring application health and revenue during high-traffic events requires a data layer that can handle thousands of incoming logs per second. The guide on how to Build a Real-Time Analytics Dashboard — AI Workflow | Terminal Skills paired with this Real-Time Analytics Dashboard demonstrates how modern SaaS teams achieve second-by-second visibility.
Key elements of the architecture include:
This type of real-time website example proves that thoughtful backend buffering can deliver live metrics while protecting primary databases from read/write bottlenecks.
Customer support portals, collaborative team spaces, and live event channels rely on low-latency messaging. The ChatFlow Live - Real-time Chat Application illustrates how modern edge networks make instant user-to-user interactions feel natural and dependable.
Core highlights of the platform include:
By removing latency from user interactions, conversational tools build trust and keep participants engaged in the discussion.
Understanding active website traffic requires clean visual hierarchy and reliable background connections. The Ratnakar-Ravada/realtime-analytics-dashboard project offers an open-source model for displaying audience metrics as they occur.
Key takeaways from this project include:
This setup offers a clear, accessible blueprint for teams building real-time observability dashboards on standard open-source tools.
Real-time technology is equally practical in public sector applications, where managing physical crowds improves customer satisfaction. An example is covered in the report where the NCDMV launches online tool to show real-time wait ... times across driver license field offices.
Practical lessons from this implementation include:
When complex institutional data is translated into simple, live dashboards, it makes everyday public services significantly easier to navigate.
Civic transparency and regional economic development benefit greatly from live geographic and municipal data feeds. The City of Charlotte Open Data Portal serves as a public hub for infrastructure metrics, planning datasets, and geographic boundaries.
Notable aspects of this platform include:
We love seeing municipal platforms bring together open data and intuitive interfaces. You can view our creative philosophy on our Work page, where we focus on pairing clear visual hierarchy with structured, data-driven navigation.
Modern visual site builders and template ecosystems allow designers to deploy real-time patterns without writing custom backend engines from scratch. Community hubs like Metadrop and Webflow's design showcase demonstrate the power of component-driven interactive design.
Standout features across these builds include:
These visual builders make it easier for creative teams to prototype, test, and launch live web components quickly.
Interactive fundraising platforms rely on transparency to build credibility with donors worldwide. The UNITED24 Rebuild Map demonstrates how live geospatial reporting and donation tracking encourage active participation.
Core design elements include:
When visitors can see the direct, measurable impact of their support, transparency becomes a powerful driver of community action.
High-performing e-commerce platforms like Steam and modern retail storefronts rely on real-time data to personalize shopping experiences.
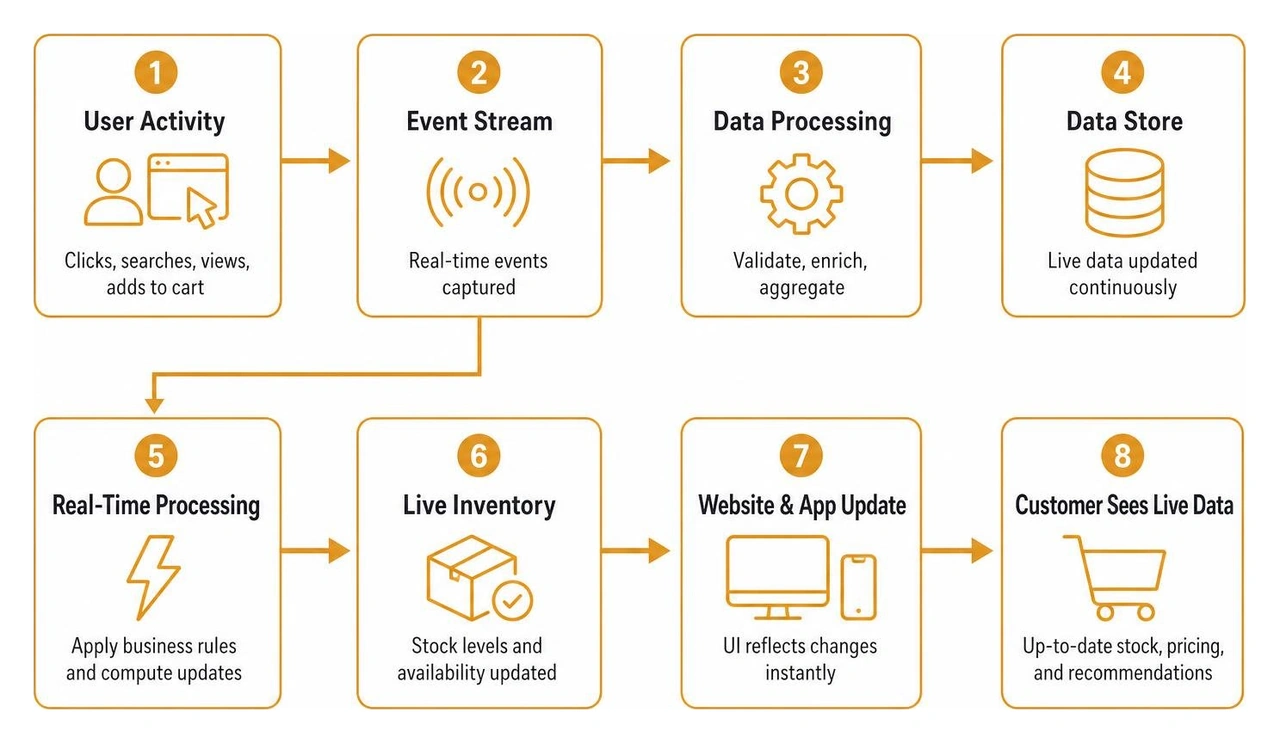
Key strategies employed by modern live commerce sites include:
Providing immediate feedback throughout the shopping experience reduces hesitation, leading to clearer choices and higher conversion rates.
Building a real-time web platform requires balancing smooth performance with clean usability. When interfaces update constantly, thoughtful design prevents the layout from feeling overwhelming or erratic.
Below are core technical and UX principles to keep in mind:
Choose your data transport method based on communication needs to avoid unnecessary server complexity:
| Protocol / Method | Directionality | Typical Latency | Best Use Cases |
|---|---|---|---|
| WebSockets | Full Duplex (Bi-directional) | < 50ms | Live chat, collaborative editing, interactive multiplayer |
| Server-Sent Events (SSE) | Simplex (Server to Client) | < 100ms | Stock tickers, logistics trackers, live scoreboards |
| Short / Long Polling | Unidirectional (Client Request) | 500ms - 5s | Low-frequency dashboards, legacy system integrations |
Do not make users wait for server round-trips for basic actions. When a user submits a chat message, checks off a task, or clicks a reaction, update the interface instantly. If the background network request encounters an error, roll back the visual change gracefully and display a brief, helpful error notification.
Real-time connections occasionally drop on mobile devices or unstable networks. Always include subtle UI indicators that display whether the feed is live, reconnecting, or displaying cached offline data.
Constantly shifting text or flashing data points can create serious barriers for users with visual or vestibular sensitivities:
aria-live="polite") so screen readers announce changes without interrupting the user.prefers-reduced-motion setting by disabling non-essential transition animations.An interactive website reacts to direct visitor inputs, such as expanding an accordion menu, scrolling through a timeline, or filtering an on-screen list with client-side JavaScript.
A real-time website maintains an active connection to backend data sources. It pushes and receives new information automatically, such as live chat messages, fluctuating stock levels, or active queue lengths, without requiring the user to reload the page.
Real-time websites generally use a combination of persistent transport layers and distributed messaging tools:
High-traffic real-time sites use architectural buffers to protect core databases from being overwhelmed. Incoming data streams are usually ingested into in-memory caches like Redis, aggregated over set intervals, and then written to disk in partitioned batches.
Static assets and client application bundles are served from global Content Delivery Networks (CDNs), ensuring that only the lightweight data payloads travel over active WebSocket or SSE connections.
Designing an effective real-time platform requires balancing technical speed with clear visual communication. For 16 years, Social Design House has operated as a Charlotte-based 10-person creative studio and fractional creative team. We build brand identities, strategy, high-performing websites on Webflow and WordPress, content creation, performance marketing, and our AI Brand Framework.
We believe that simple, not easy is the benchmark for great design, and that clarity is a gift for your audience. Whether you are modernizing a customer portal or scaling your market presence, we are here to help you find your sweet spot.
If you are looking to create an engaging digital platform that drives results, explore our specialized work in commercial real estate website marketing in Charlotte and see how we can serve as a seamless extension of your team. Excited to continue crafting digital experiences that turn live data into lasting customer relationships.